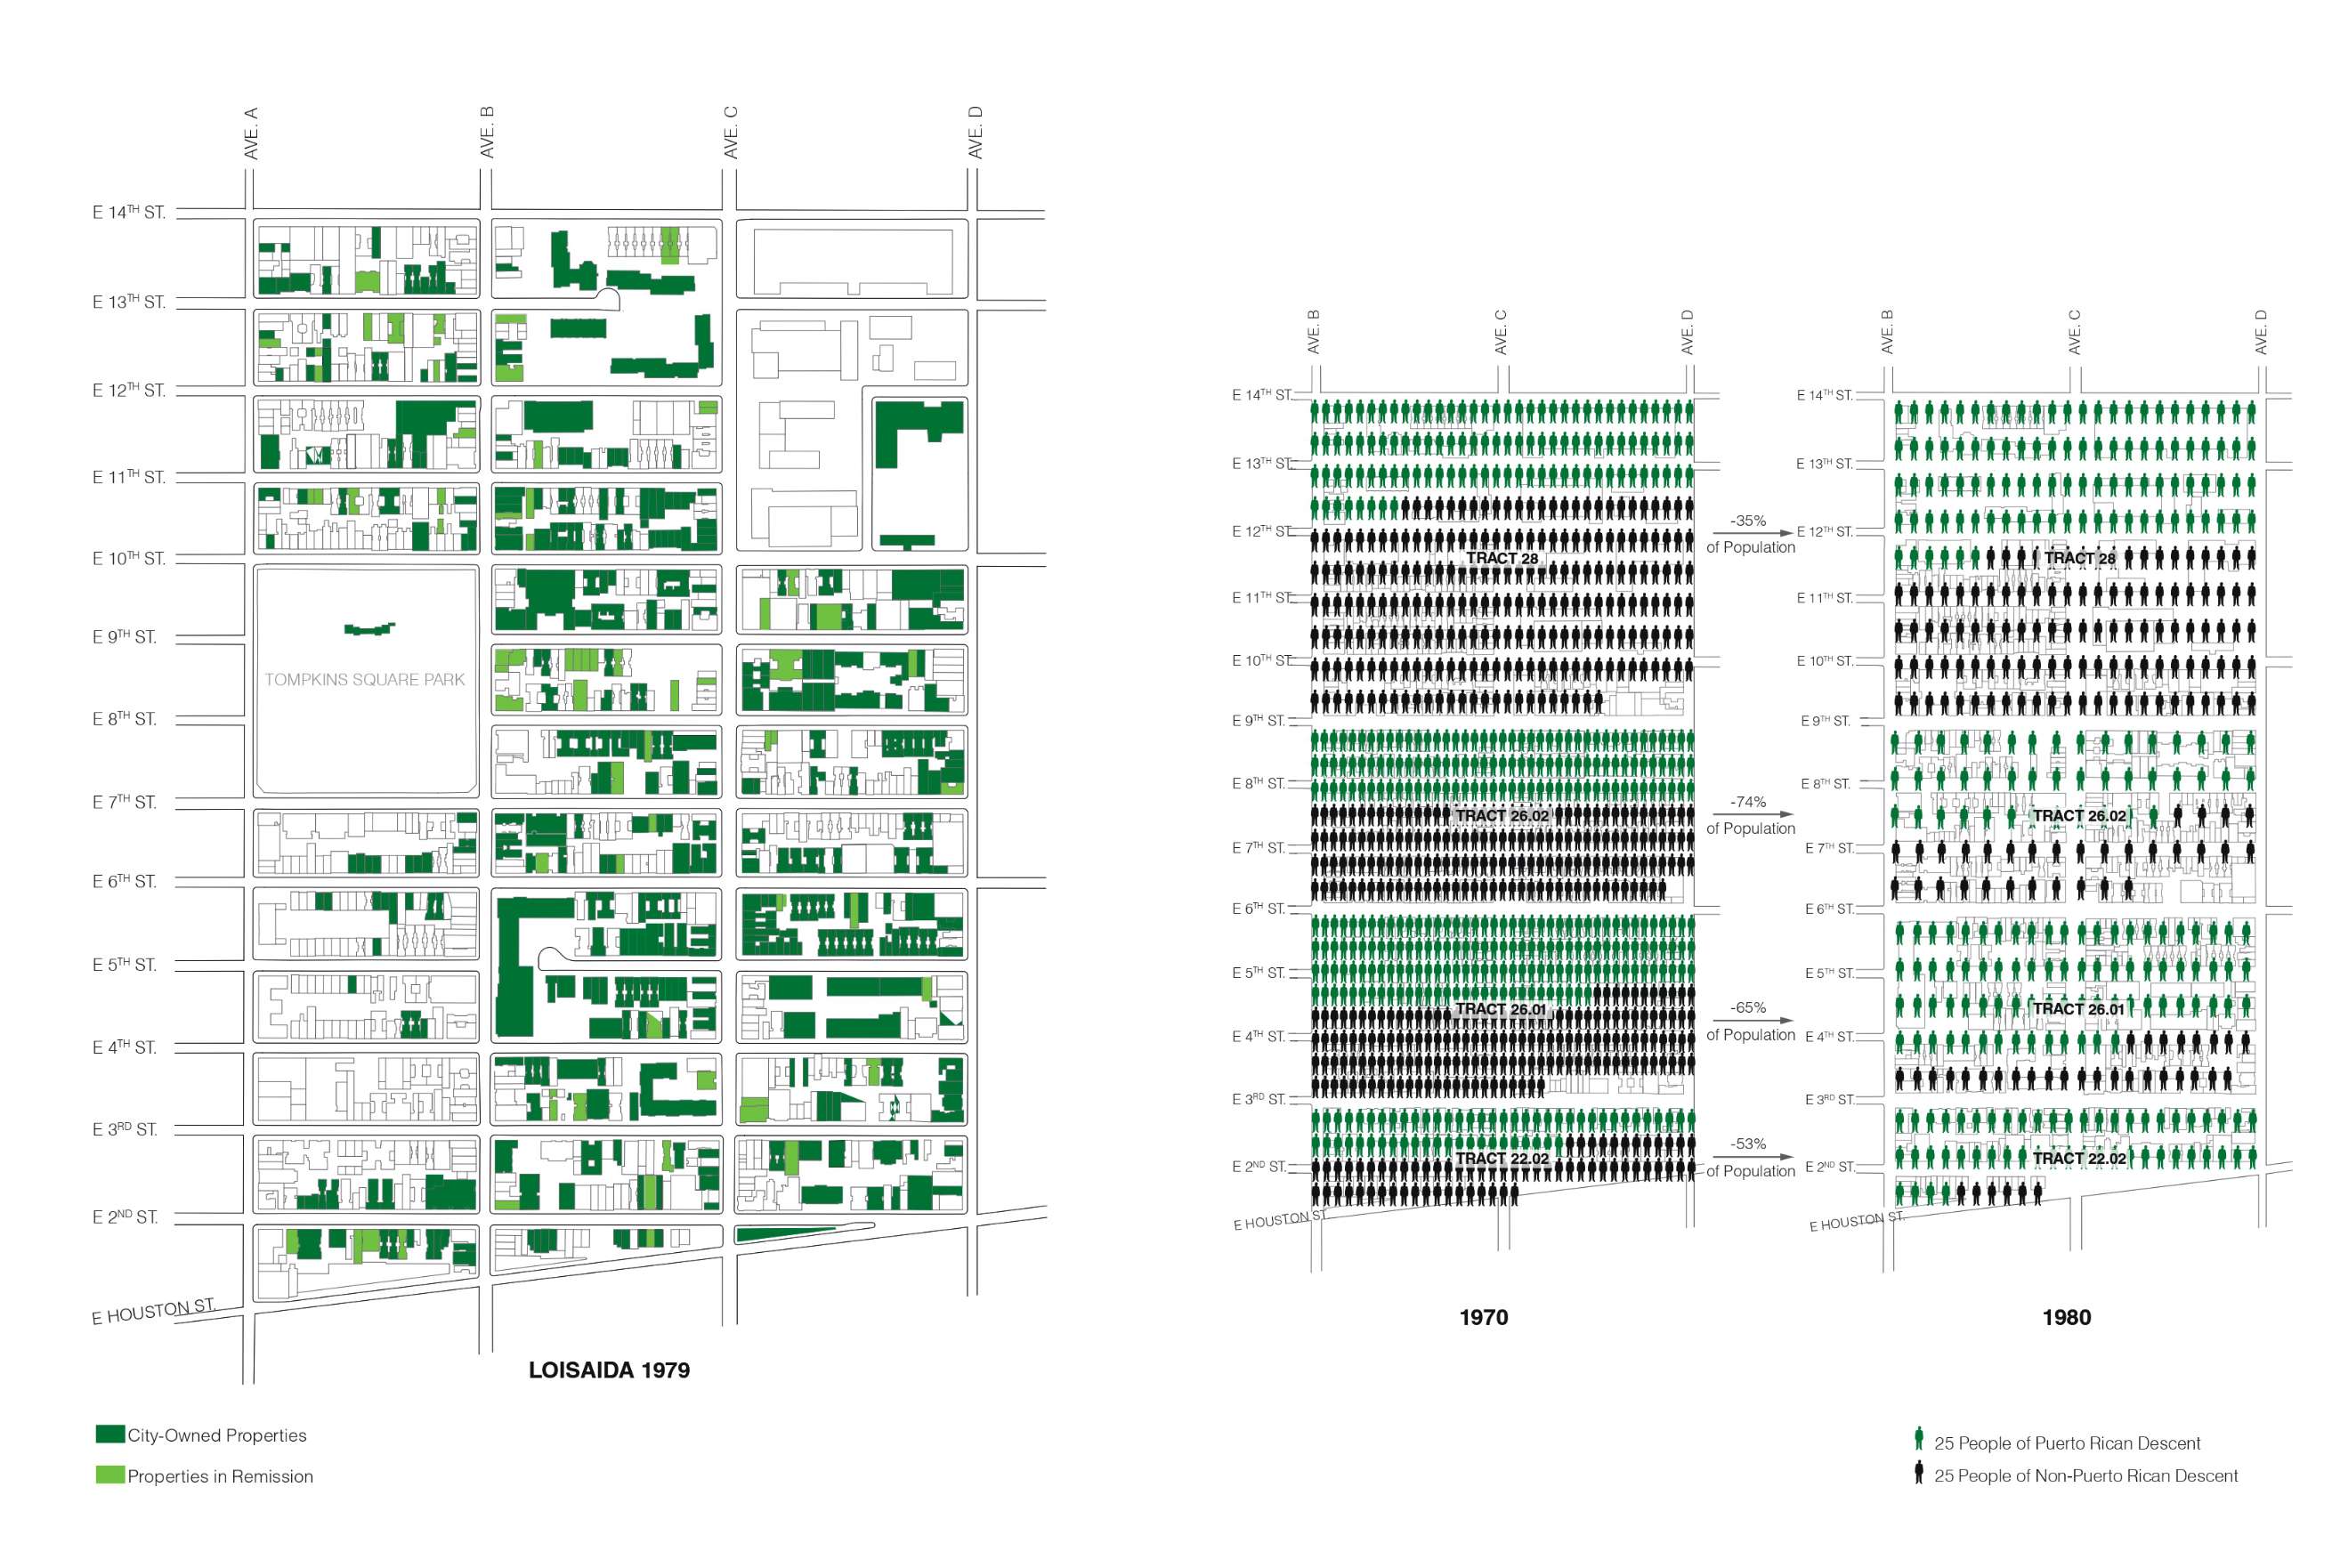
SVisualizations of city-owned property in 1979 with the blocks of “Loisaida” mapped against corresponding demographic data. The drawing shows the de-population of the blocks between 1970 and 1980. The free figures denote Puerto Rican residents and the black figures indicate non-Puerto Rican residents
Drawings based on US Census Data as well as maps compiled by interfaith Adopt-A-Building in HUD reports, “Loisaida: Strategies for Neighborhood Revitalization and Self-Determination,” New York.
Illustration by Nandini Bagchee
